Tyler Tries DTrace
How a Node.js backpressure example led me to explore DTrace
As I have been making my way through the learn section on the Node.js website, I came across a pleasant surprise in the Backpressuring in Streams section:
That’s right, dtrace mentioned! Over the past ~5 months, I have gone through the entire Oxide and Friends podcast backlog, and it’s left a lasting impact on how I think about technology and software engineering. I shared more about my thoughts in this blog post.
DTrace comes up frequently in the podcast since Bryan Cantrill, one of the co-hosts, was its creator and Adam Leventhal, the other co-host, was also one of its original developers. I’m familiar with the tool from those discussions, even though I haven’t used it myself.
When learning a new programming language, I personally like to type out the examples myself and run them. However, the backpressure example didn’t go through how to instrument it with DTrace to get the results they mentioned, so I used this as an opportunity to give DTrace a spin!
First, what is DTrace? DTrace is a dynamic tracing framework, and we’ll be using it here to measure GC (garbage collection) times in Node.js to see the effects of backpressure disabled.
As described in the docs, backpressure is the buildup of data behind a buffer during data transfer. Streams in Node.js allow you to process data incrementally versus loading the entire dataset into memory. Backpressure in Node.js occurs when the Readable stream produces too much data for the Writable stream to handle.
When the Writable stream can’t keep up the data gets put into a queue waiting to be processed. This queue will continue to grow as long as the Writable stream stays behind. Managing this queue from building up is what Node’s backpressure mechanism does.
NoteNote
One thing that tripped me up is the term “backpressure” is often used in two ways:
- to describe the problem, when the consumer can’t keep up with the producer, leading to data buildup.
- to describe the solution, the mechanism that regulates or slows down the producer to prevent overload.
The example provided in the docs show compressing a video file because writing to disk is a lot slower than reading from disk. This provides a good way to demonstrate the effects of backpressure. If we turn off the backpressure mechanism, memory usage spikes and garbage collection runs more often, which is exactly what we’ll measure with DTrace.
Of course, before I could actually run the example, I ran into my first problem. The example uses a 9GB video file, The.Matrix.1080p.mkv. Unfortunately, I don’t just have a 9 GB video lying around. I asked ChatGPT where I could download a free large video file, which led me to something called “Big Buck Bunny.”
Ummm… what? I risked it and clicked the suspicious looking link which greeted me with this:

After some further research, it appears to be a legit free open movie from the Blender Foundation licensed under the Creative Commons Attribution 3.0 license. The more you know!
Anywho, I downloaded what I thought would be the largest file available:
It’s only 1020MB, so I used ffmpeg to repeat it 8 more times to get 9GB as I wanted to have a similar file size as the example.
8.9GB should do.
After looking into the example more, it looks like we need to compile a custom build of Node.js taking out the return value of the .write() function, which effectively disables backpressure support.
I decided to use the latest LTS version, which at the time of writing this is v22.20.0.
Doesn’t look like node/lib/_stream_writable.js contains that function anymore.
The link they provided was a permalink to a commit that took place 9 years ago.
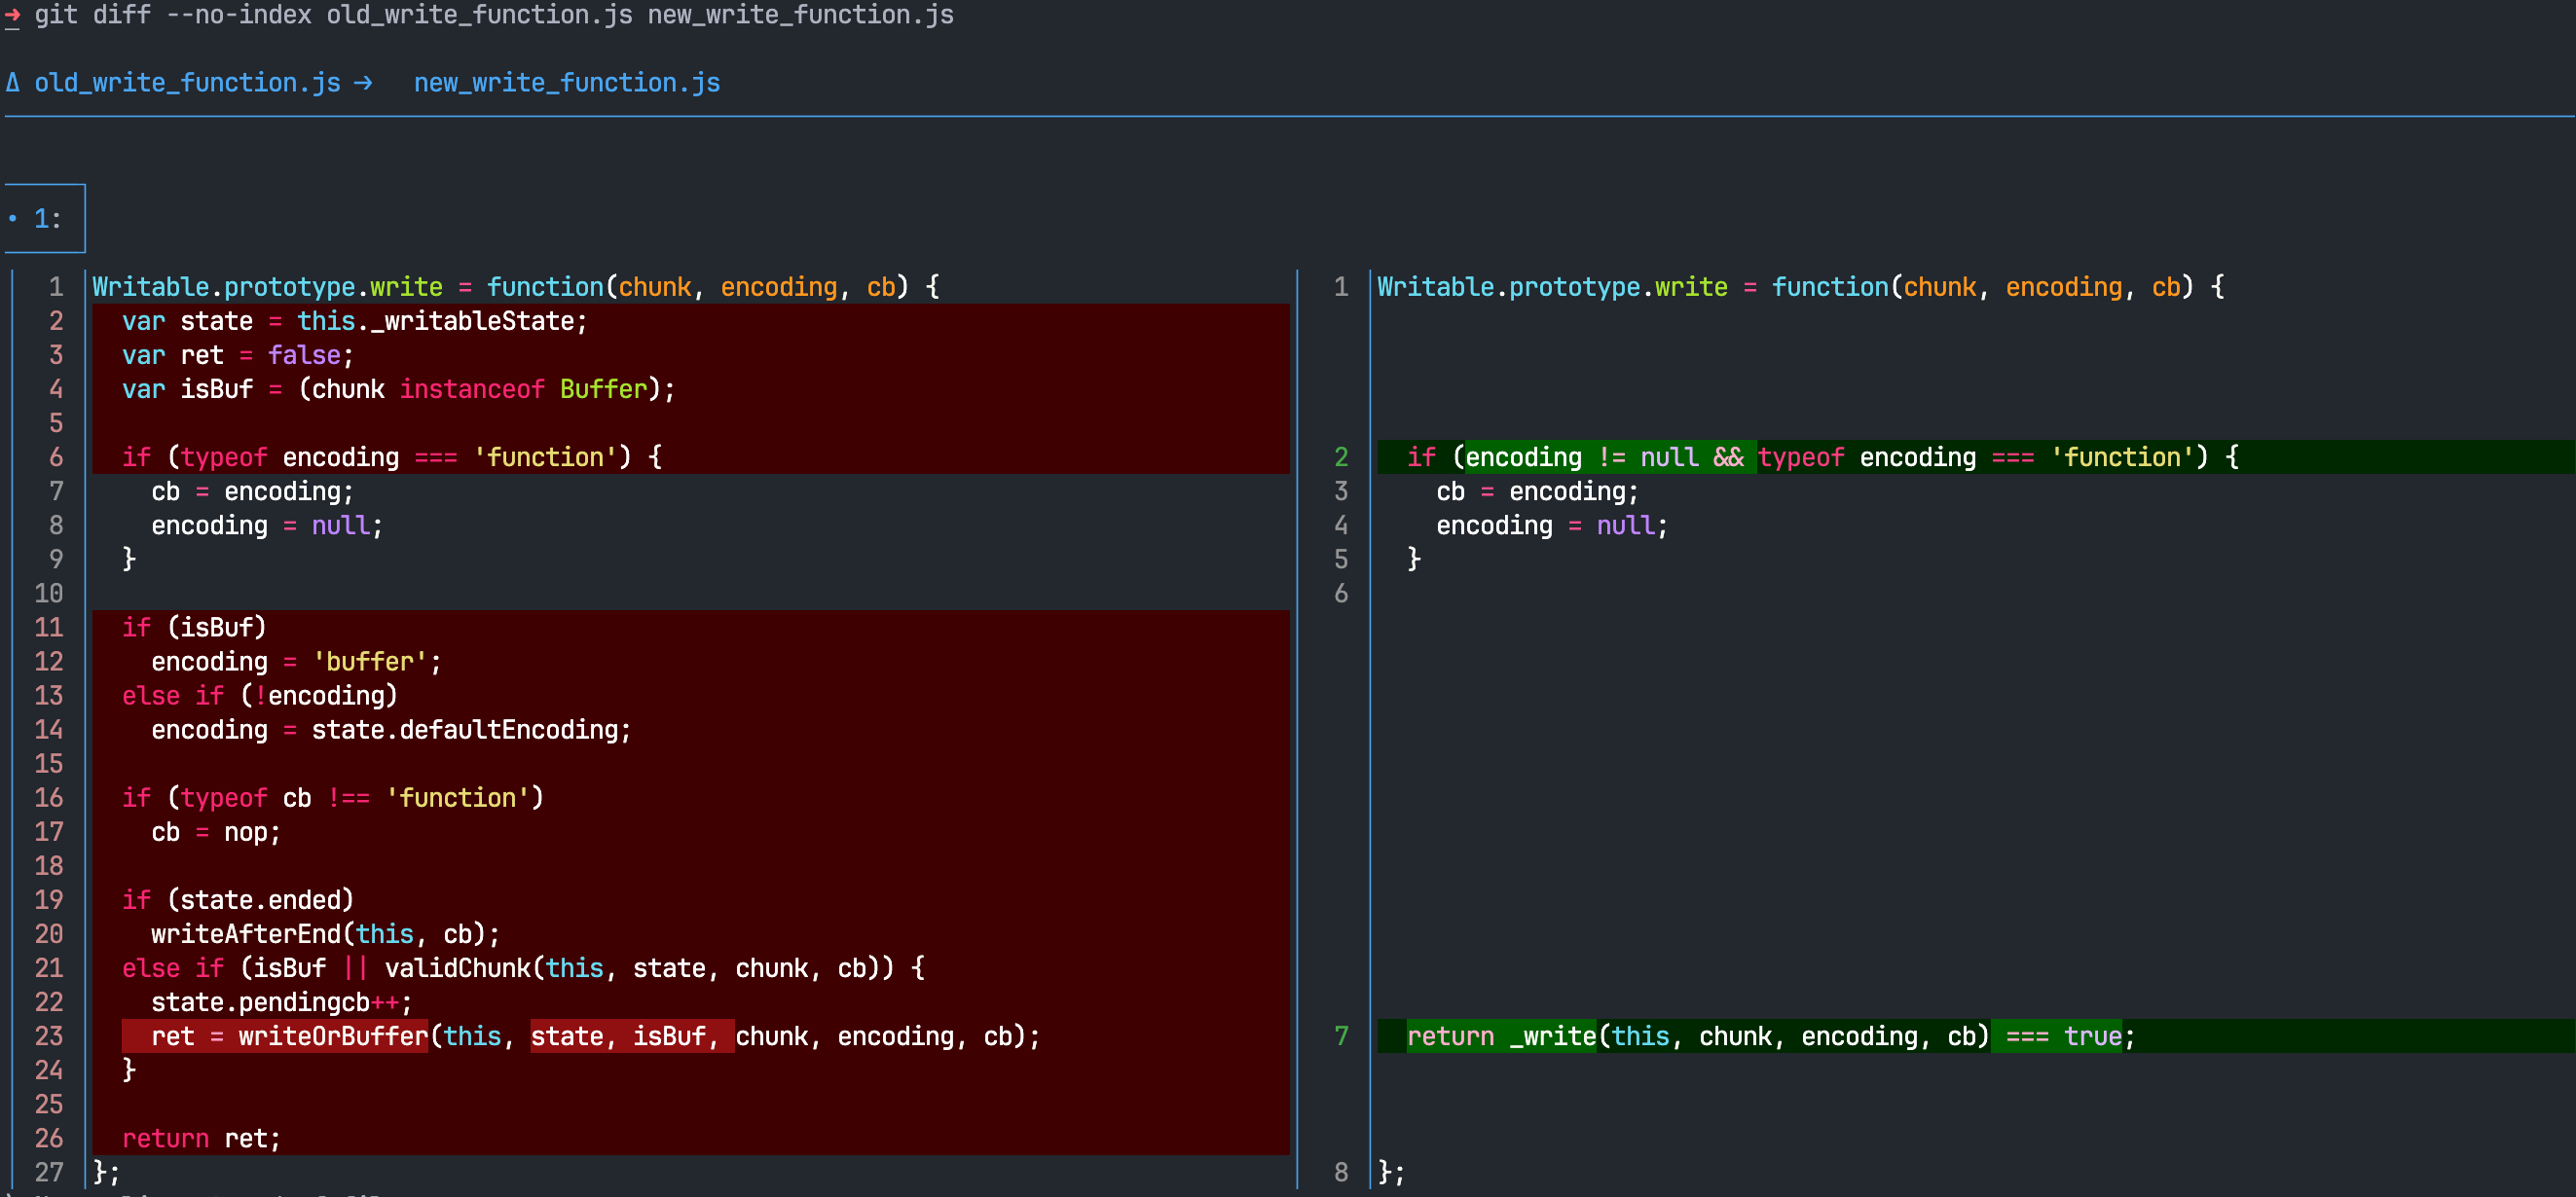
Using go to definition, it takes me to node/lib/stream.js which contains another import from /node/lib/internal/streams/writable.js. Ah finally, the Writable.prototype.write function, but wait no return ret line:
NoteSide Note
I was looking for a way to display a nice git diff between the old and new write function which is how I stumbled across this wonderful tool called delta.
I can’t believe I haven’t heard of this before! Now I can have beautiful git diffs right in my terminal.
After doing a couple more go to definitions, I found the little sucker defined in the writeOrBuffer() function in the /node/lib/internal/streams/writable.js file.
I replaced this line with return true instead.
The next step is to build Node.js from source. Luckily, Node.js has some great documentation on how to do so. I am pretty sure I had all the required prerequisites to run the build process, so I went forward with the commands outlined in the guide:
Buttt it blew up on me when I ran ./configure
intro-to-node-js/node git:(v22.20.0) ✗
➜ ./configure
Node.js configure: Found Python 3.13.8...
Traceback (most recent call last):
  File "/Users/tyler/code/learning/node-js-notes/intro-to-node-js/node/./configure", line 28, in <module>
    import configure
  File "/Users/tyler/code/learning/node-js-notes/intro-to-node-js/node/configure.py", line 2274, in <module>
    check_compiler(output)
    ~~~~~~~~~~~~~~^^^^^^^^
  File "/Users/tyler/code/learning/node-js-notes/intro-to-node-js/node/configure.py", line 1237, in check_compiler
    ok, is_clang, clang_version, gcc_version = try_check_compiler(CXX, 'c++')
    ^^^^^^^^^^^^^^^^^^^^^^^^^^^^^^^^^^^^^^^^
ValueError: too many values to unpack (expected 4)
Hmmm, I set up a breakpoint on that line to step into what’s happening with try_check_compiler(CXX, 'c++'). There are only two return statements in there, and only one of them returns more than four values, which implies I was hitting an OSError:
Oddly enough I didn’t hit that error running it directly through the VS Code debugger. This is puzzling. I never used the built in pdb before but I thought I would give that a try and indeed it raised the OSError.
➜ ./configure
Node.js configure: Found Python 3.13.9...
> /Users/tyler/code/learning/node-js-notes/intro-to-node-js/node/configure.py(1238)check_compiler()
-> import pdb; pdb.set_trace()
(Pdb) n
> /Users/tyler/code/learning/node-js-notes/intro-to-node-js/node/configure.py(1239)check_compiler()
-> ok, is_clang, clang_version, gcc_version = try_check_compiler(CXX, 'c++')
(Pdb) s
--Call--
> /Users/tyler/code/learning/node-js-notes/intro-to-node-js/node/configure.py(1115)try_check_compiler()
-> def try_check_compiler(cc, lang):
(Pdb) n
> /Users/tyler/code/learning/node-js-notes/intro-to-node-js/node/configure.py(1116)try_check_compiler()
-> try:
(Pdb) n
> /Users/tyler/code/learning/node-js-notes/intro-to-node-js/node/configure.py(1117)try_check_compiler()
-> proc = subprocess.Popen(shlex.split(cc) + ['-E', '-P', '-x', lang, '-'],
(Pdb) n
> /Users/tyler/code/learning/node-js-notes/intro-to-node-js/node/configure.py(1118)try_check_compiler()
-> stdin=subprocess.PIPE, stdout=subprocess.PIPE)
(Pdb) n
> /Users/tyler/code/learning/node-js-notes/intro-to-node-js/node/configure.py(1117)try_check_compiler()
-> proc = subprocess.Popen(shlex.split(cc) + ['-E', '-P', '-x', lang, '-'],
(Pdb) n
FileNotFoundError: [Errno 2] No such file or directory: 'g++-12'
> /Users/tyler/code/learning/node-js-notes/intro-to-node-js/node/configure.py(1117)try_check_compiler()
-> proc = subprocess.Popen(shlex.split(cc) + ['-E', '-P', '-x', lang, '-'],
(Pdb) n
> /Users/tyler/code/learning/node-js-notes/intro-to-node-js/node/configure.py(1119)try_check_compiler()
-> except OSError:
(Pdb) n
> /Users/tyler/code/learning/node-js-notes/intro-to-node-js/node/configure.py(1120)try_check_compiler()
-> return (False, False, '', '', False)
Ahhh I’m an idiot. FileNotFoundError: [Errno 2] No such file or directory: 'g++-12' I blindly just copied the command export CXX=g++-12, but I don’t have that installed. The VS Code debugger didn’t have CXX set because I just set that environment variable within my terminal session.
After unsetting CXX it completed successfully.
The next step was running make:
A couple of minutes after running the command, I left hoping it would be finished when I got back. 10 minutes later I returned, and I thought my MacBook was getting ready for takeoff. Seriously, listen:
This was the first time I have ever had my fans turn on for this machine. Eventually, the build did complete in about ~30min.
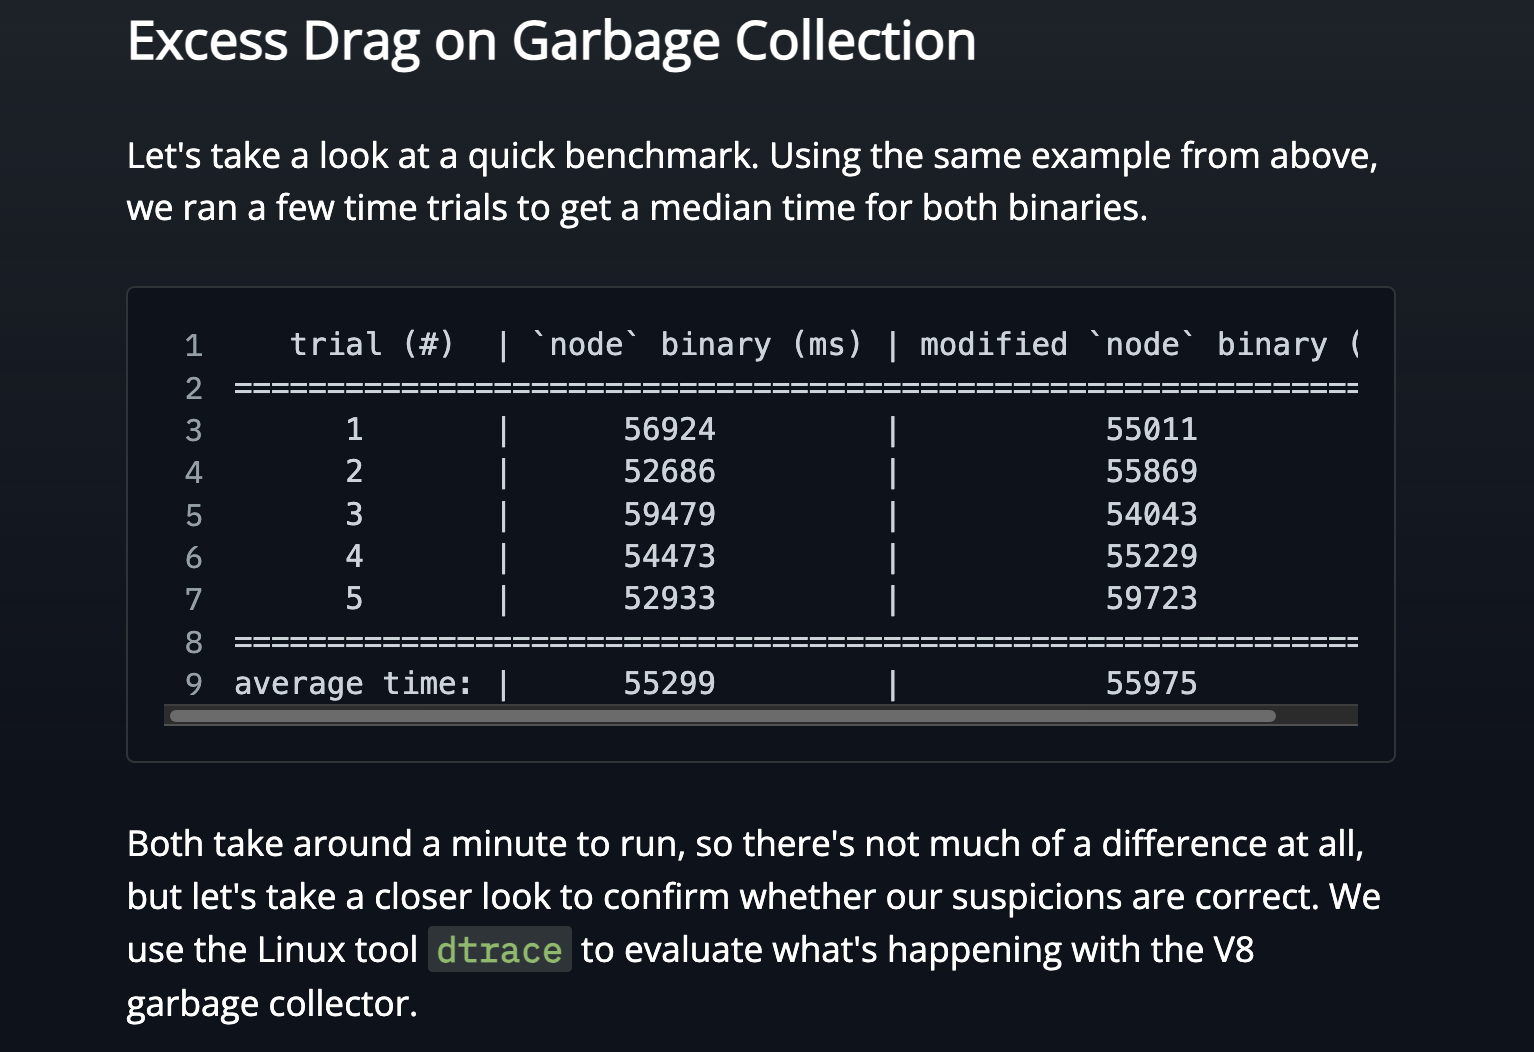
I copied the stream/promises example they had and ran the script for both versions, modified (backpressure disabled) and an unmodified version of Node.js:
   trial (#)  | `node` binary (ms) | modified `node` binary (ms)
=================================================================
      1       |      137040        |          139900
      2       |      136362        |          139999
      3       |      141825        |          142009
      4       |      136131        |          143897
      5       |      139041        |          142208
=================================================================
average time: |      138080        |          141603
Slower than the example, but I am going to chalk that up to “my machine vs their machine” and user error. The numbers between the unmodified and modified versions are comparable, which is what I wanted to see.
Now it’s time to setup DTrace to reproduce the GC measured time. I recall in a talk by Adam Leventhal, DTrace was “castrated” when macOS released System Integrity Protection (SIP). Disabling SIP made me feel uneasy. After some googling though, I came across this blog post, which used UTM to create a macOS virtual machine with SIP disabled.
This was something I was much more comfortable with, so I spun up a VM in recovery mode and ran csrutil disable to disable SIP.
NoteNote
I later learned that disabling SIP wasn’t needed for what I was trying to measure. If I would have done a better job of listening to Adam in his talk, he clearly states:
If you’re running the pid provider, if you’re looking at processes that you own, if you’re looking at USDT probes, all of that can be done with SIP enabled.
Which is all I needed for the Node.js probes.
macOS comes with dtrace preinstalled, so with a little help from GitHub Copilot, I asked if it could show me how to measure Node.js GC time.
tylerhillery@Tylers-Virtual-Machine intro-to-node-js % sudo dtrace -n 'node*:::gc-start { self->ts = timestamp; }
                node*:::gc-done /self->ts/ { printf("%d ms\n", (timestamp - self->ts)/1000000); self->ts = 0; }' -p 15088
dtrace: invalid probe specifier node*:::gc-start { self->ts = timestamp; }
                node*:::gc-done /self->ts/ { printf("%d ms\n", (timestamp - self->ts)/1000000); self->ts = 0; }: probe description node*:::gc-start does not match any probes
Hmmm, doesn’t look like my Node.js process is generating any DTrace probes. After some more googling, it appears Node.js doesn’t enable DTrace probes by default, but apparently I can enable them with a flag. I couldn’t find any mentions of DTrace in the Node.js codebase, but after grepping through the commit history, I was able to find this commit:
intro-to-node-js/node git:(v22.20.0) ✗
➜ git show --no-patch aa3a572e6be
commit aa3a572e6bee116cde69508dc29478b40f40551a
Date:   Sun Jul 17 18:33:52 2022 +0200

    build: remove dtrace & etw support

    There are no clear indicators anyone is using the dtrace USDT probes.

    ETW support is very intertwined with the dtrace infrastructure. It's not
    clear if anyone uses ETW so to keep things simple it too is removed.

    Fixes: https://github.com/nodejs/node/issues/43649

    PR-URL: https://github.com/nodejs/node/pull/43652
You got to be kidding me. Well, it was at this moment that I found out Node.js recommends using the --trace-gc flag for measuring GC nowadays.
But I have come so far, and I really wanted to see if I could get DTrace working on the latest LTS release. I could use an older version of Node.js that had DTrace enabled, but that’s no fun. Do it for the gram blog!
The problem is my C++ skills are lacking… to say the least, and the codebase has changed so much since DTrace was removed that a simple git revert wouldn’t help here. This seemed like a good use case for AI though, as I can provide it the context of the diff where it was removed and see if it can add it back in.
I gave Copilot the task, and a few minutes later I had a successful build of Node.js v22.20.0 with DTrace enabled. No clue if it’s actually right, but I don’t really care at this point. I just wanted to see those Node.js probes!
You might be asking, what is a probe anyway? The Dynamic Tracing Guide has a nice section on them:
DTrace helps you understand a software system by enabling you to dynamically modify the operating system kernel and user processes to record additional data that you specify at locations of interest, called probes. A probe is a location or activity to which DTrace can bind a request to perform a set of actions, like recording a stack trace, a timestamp, or the argument to a function. Probes are like programmable sensors scattered all over your illumos system in interesting places.
With this helpful context, let’s see if we can see those probes now:
tylerhillery@Tylers-Virtual-Machine node-js-notes % sudo dtrace -l -n 'node*:::gc*'
   ID   PROVIDER            MODULE                          FUNCTION NAME
 2904   node2008              node _ZN4node14dtrace_gc_doneEPN2v87IsolateENS0_6GCTypeENS0_15GCCallbackFlagsEPv [node::dtrace_gc_done(v8::Isolate*, v8::GCType, v8::GCCallbackFlags, void*)] gc-done
 2905   node2008              node _ZN4node15dtrace_gc_startEPN2v87IsolateENS0_6GCTypeENS0_15GCCallbackFlagsEPv [node::dtrace_gc_start(v8::Isolate*, v8::GCType, v8::GCCallbackFlags, void*)] gc-start
We are back in business baby.
Let’s try tracking GC times again and break down each step of this dtrace command:
tylerhillery@Tylers-Virtual-Machine node-js-notes % sudo dtrace -n 'dtrace:::BEGIN { start = timestamp; } node2008:::gc-start { self->ts = timestamp; } node2008:::gc-done /self->ts/ { printf("%d,%d\n", (timestamp - start)/1000000, (timestamp - self->ts)/1000000); self->ts = 0; }'
dtrace: description 'dtrace:::BEGIN ' matched 3 probes
CPU     ID                    FUNCTION:NAME
  2   2904 _ZN4node14dtrace_gc_doneEPN2v87IsolateENS0_6GCTypeENS0_15GCCallbackFlagsEPv:gc-done 173,0
0 2904 _ZN4node14dtrace_gc_doneEPN2v87IsolateENS0_6GCTypeENS0_15GCCallbackFlagsEPv:gc-done 429,0-nenabled or list probes matching the specified probe namedtrace:::BEGIN { start = timestamp; }TheBEGINprobe fires once each time you start a new tracing request.timestampis a DTrace variable that returns the value of an always incrementing nanosecond counter. We are saving it here tostartso we can keep track of the time elapsed since the start of the DTrace tracing requestnode2008:::gc-start { self->ts = timestamp; }very similar to what we are doing above but this time saving the timestamp of thenode2008:::gc-startprobenode2008:::gc-done /self->ts/ { ... }This fires when GC completes, with a predicate/self->ts/to ensure we only process gc-done events that have a corresponding gc-start. Let’s break down what happens inside:printf("%d,%d\n", (timestamp - start)/1000000, (timestamp - self->ts)/1000000)Prints two comma-separated values:- Time elapsed since tracing started (in milliseconds)
- Duration of this GC cycle (in milliseconds)
self->ts = 0Resets the GC start timestamp for the next cycle
I measured the GC times with DTrace on the modified (backpressure disabled) and unmodified versions of Node.js. For completeness sake, I also measured GC times with the --trace-gc flag as well. Here are the results:
Now, I wouldn’t take the numbers too seriously as I have broken many benchmarking sins here, but the general takeaway is true regardless. Disabling backpressure clearly makes the GC work much harder.
This was interesting to see, but it has me left wondering, how does the Node.js backpressure mechanism work? Well, this gets explained later on in the docs.
Essentially, when a false is returned from the writeOrBuffer(), it will pause the Readable stream from sending any data and wait until the consumer is ready again, which gets notified by the drain event. The writeOrBuffer() function will return false when the data buffer has exceeded the highWaterMark or the write queue is internally busy.
Caution
This explanation is based on the current Node.js docs at the time of writing. It looks like the writeOrBuffer() function may have additional logic now compared to older write() function, so behavior could differ depending on your Node.js version.
Hopefully, this post demystifies a bit of how backpressure works in Node.js and how you can use DTrace to measure GC. Now it’s time to go watch Big Buck Bunny!